Collector Current Graph
The graph shows collector current versus accelerating voltage. The current rises overall, but repeated inelastic collisions with mercury atoms produce minima and maxima separated by about 4.9 V.
Bohr Model of Mercury
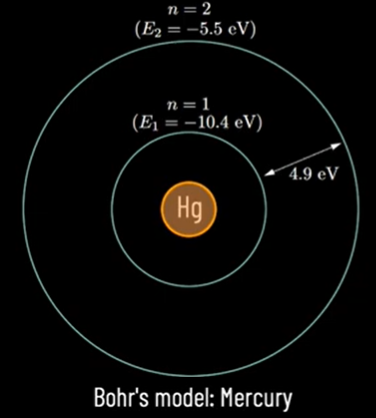
The 4.9 eV spacing in the Franck–Hertz graph corresponds to an excitation energy of the mercury atom.